

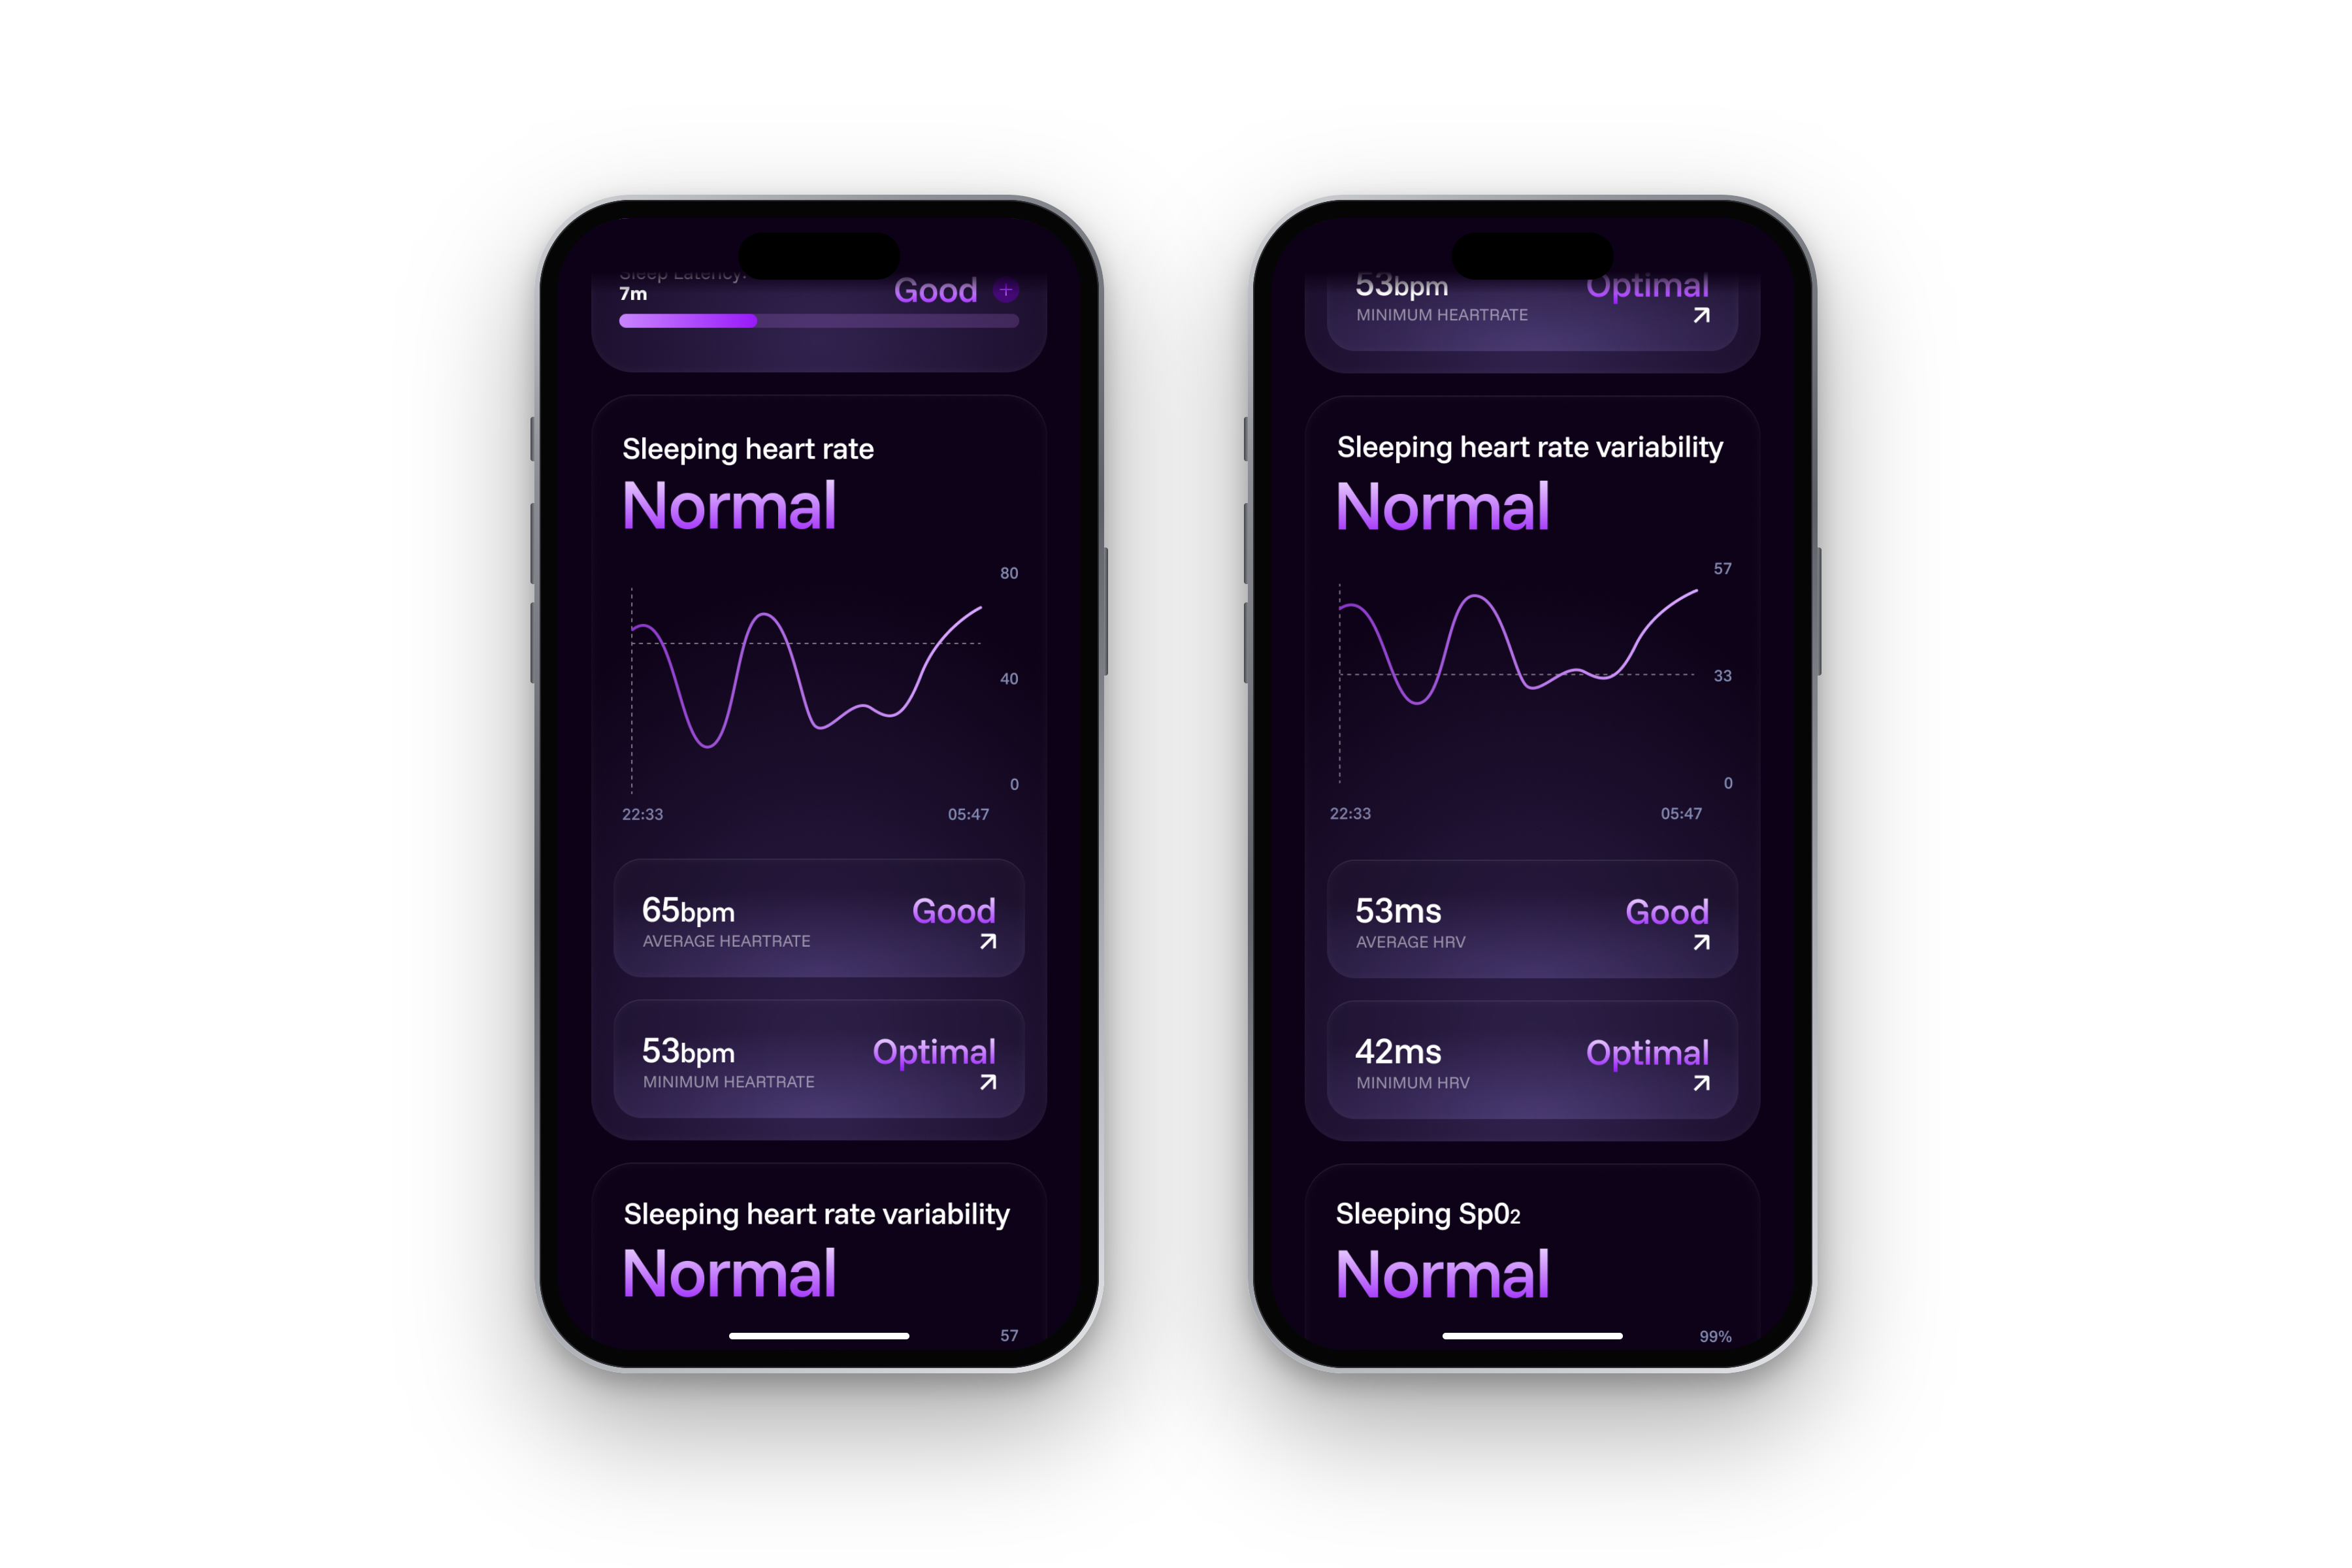
Three months ago I started wearing a Leep ring, and if you've recently bought an Apple Watch, a Whoop band, a Garmin, or a smart ring, you'll know the routine you fall into when you first get one of these devices: you wake up, open the app, and there's a range of numbers waiting for you. One of them is usually sleeping (or resting, but more on that soon) heart rate, and mine said 63 bpm.
My first reaction was along the lines of "oh, that's interesting", followed very quickly by "is that good?". Although I didn't want to admit it, I had no idea what it meant. Was 63 good? Was it bad? Should I be worried that Tuesday was 6 bpm higher than Monday? The number was giving me more questions than answers.
As it turns out, this is a very common experience that many people go through, yet the research on it is quite thorough. So, in today's article, I want to discuss sleeping heart rate - what your device is actually measuring, what a normal range looks like, whether age matters, and what causes the fluctuations in the number from night to night. We’ll then move on to heart rate variability (HRV), which is an even more confusing number, but a similarly important one.
Before we go on, please note that I'm not a doctor, and nothing in this article is medical advice. The ranges we'll discuss in this article come from published studies of large populations, and they are useful for context, but they can't tell you whether your number is healthy for you. If your sleeping heart rate or HRV changes suddenly and stays changed, or if you have symptoms like dizziness, chest discomfort or unusual fatigue, please speak to your GP rather than relying on a ring or a blog post such as this one. With that mentioned, let's dive in.
What is your device actually measuring?
Let’s start by being clear on what the number in your app is, because this is the first area where it's easy to get tripped up. The "resting heart rate" your doctor takes when you visit is measured sitting still for a few minutes during the day. The number your ring or watch reports is usually quite different: it is usually taken while you are asleep, which is a very different physiological state. Therefore, it's actually expected that the 'resting' heart rate that your device presents is different from what your doctor measures when you visit.
How different? Well, Cleveland Clinic cardiologist Dr Ashley Faulx puts sleeping heart rate at roughly 20% to 30% below your daytime resting heart rate, and notes that it cycles down further during non-REM sleep, particularly deep sleep. In a Danish study of 653 adults who wore a 48-hour ECG, the average resting heart rate was 72.5 bpm, the 24-hour average was 75.8 bpm, and the night-time heart rate (measured between 2:00 and 2:15 am) was 65.9 bpm. That's a 6 to 7 bpm gap between "resting" and "asleep" in the same people on the same day.
It's also worth knowing that most wearables blur this line. In the largest wearable heart rate study to date (92,457 Fitbit users over two years), the authors note that the daily "resting heart rate" reported by the device was primarily calculated during periods of sleep. So if your app calls it resting heart rate, it is probably a sleeping heart rate anyway. This is important because it means the daytime "60 to 100 bpm is normal" range you may have heard is the wrong benchmark for the number you're looking at.
Within the night itself, your heart rate isn't flat either. During non-REM sleep the vagus nerve dominates and heart rate drops, and this is periodically interrupted by REM sleep, where heart rate rises as vagal tone is withdrawn and sympathetic activity can reach levels higher than when you're awake. If your app shows a graph with a few bumps through the night, that is REM doing its thing, and not a problem.
What is a normal sleeping heart rate?
Okay, so we've now established that a 'resting' heart rate number from your wearable is probably actually your sleeping heart rate. Now for the number everyone wants. The honest answer is that "normal" is a very wide band, and the big datasets all agree on that.
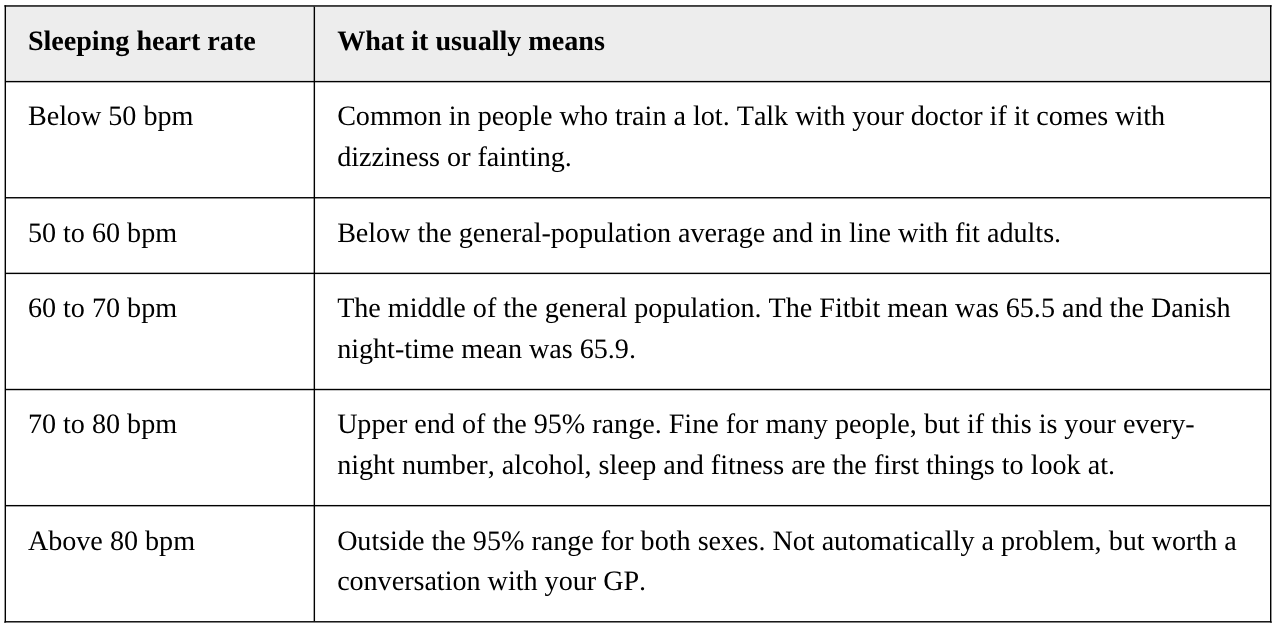
In the Fitbit study mentioned above, the mean resting heart rate was 65.5 bpm, but individual averages ranged from 39.7 to 108.6 bpm. 95% of men fell between 50 and 80 bpm, and 95% of women between 53 and 82 bpm. In the Danish ECG cohort (aged 55 to 75), night-time heart rate averaged 65.9 bpm with a standard deviation of 10.4. And in Whoop's own member data, which skews towards athletes and the very health-conscious, average resting heart rate is 55.2 bpm for men and 58.8 bpm for women.
Putting those together, here is an overview of sleeping heart rate ranges:
One thing I'd like to stress: these are population ranges, and the Fitbit paper's central finding is that they are a poor guide to any one individual. Sex, age, BMI and sleep duration together explained no more than 10% of the variation between people, and individuals have a daily resting heart rate that is normal for them but can differ from another individual's normal by as much as 70 bpm. Your number being 8 bpm above your friend's tells you almost nothing.
Individuals have a daily RHR that is normal for them but can differ from another individual’s normal by as much as 70 bpm. (Inter- and intraindividual variability in daily resting heart rate and its associations with age, sex, sleep, BMI, and time of year: Retrospective, longitudinal cohort study of 92,457 adults)
Does age actually matter for sleeping heart rate?
This one surprised me, because most "heart rate by age" charts online imply a downward staircase, but the data doesn't really show that for adults.
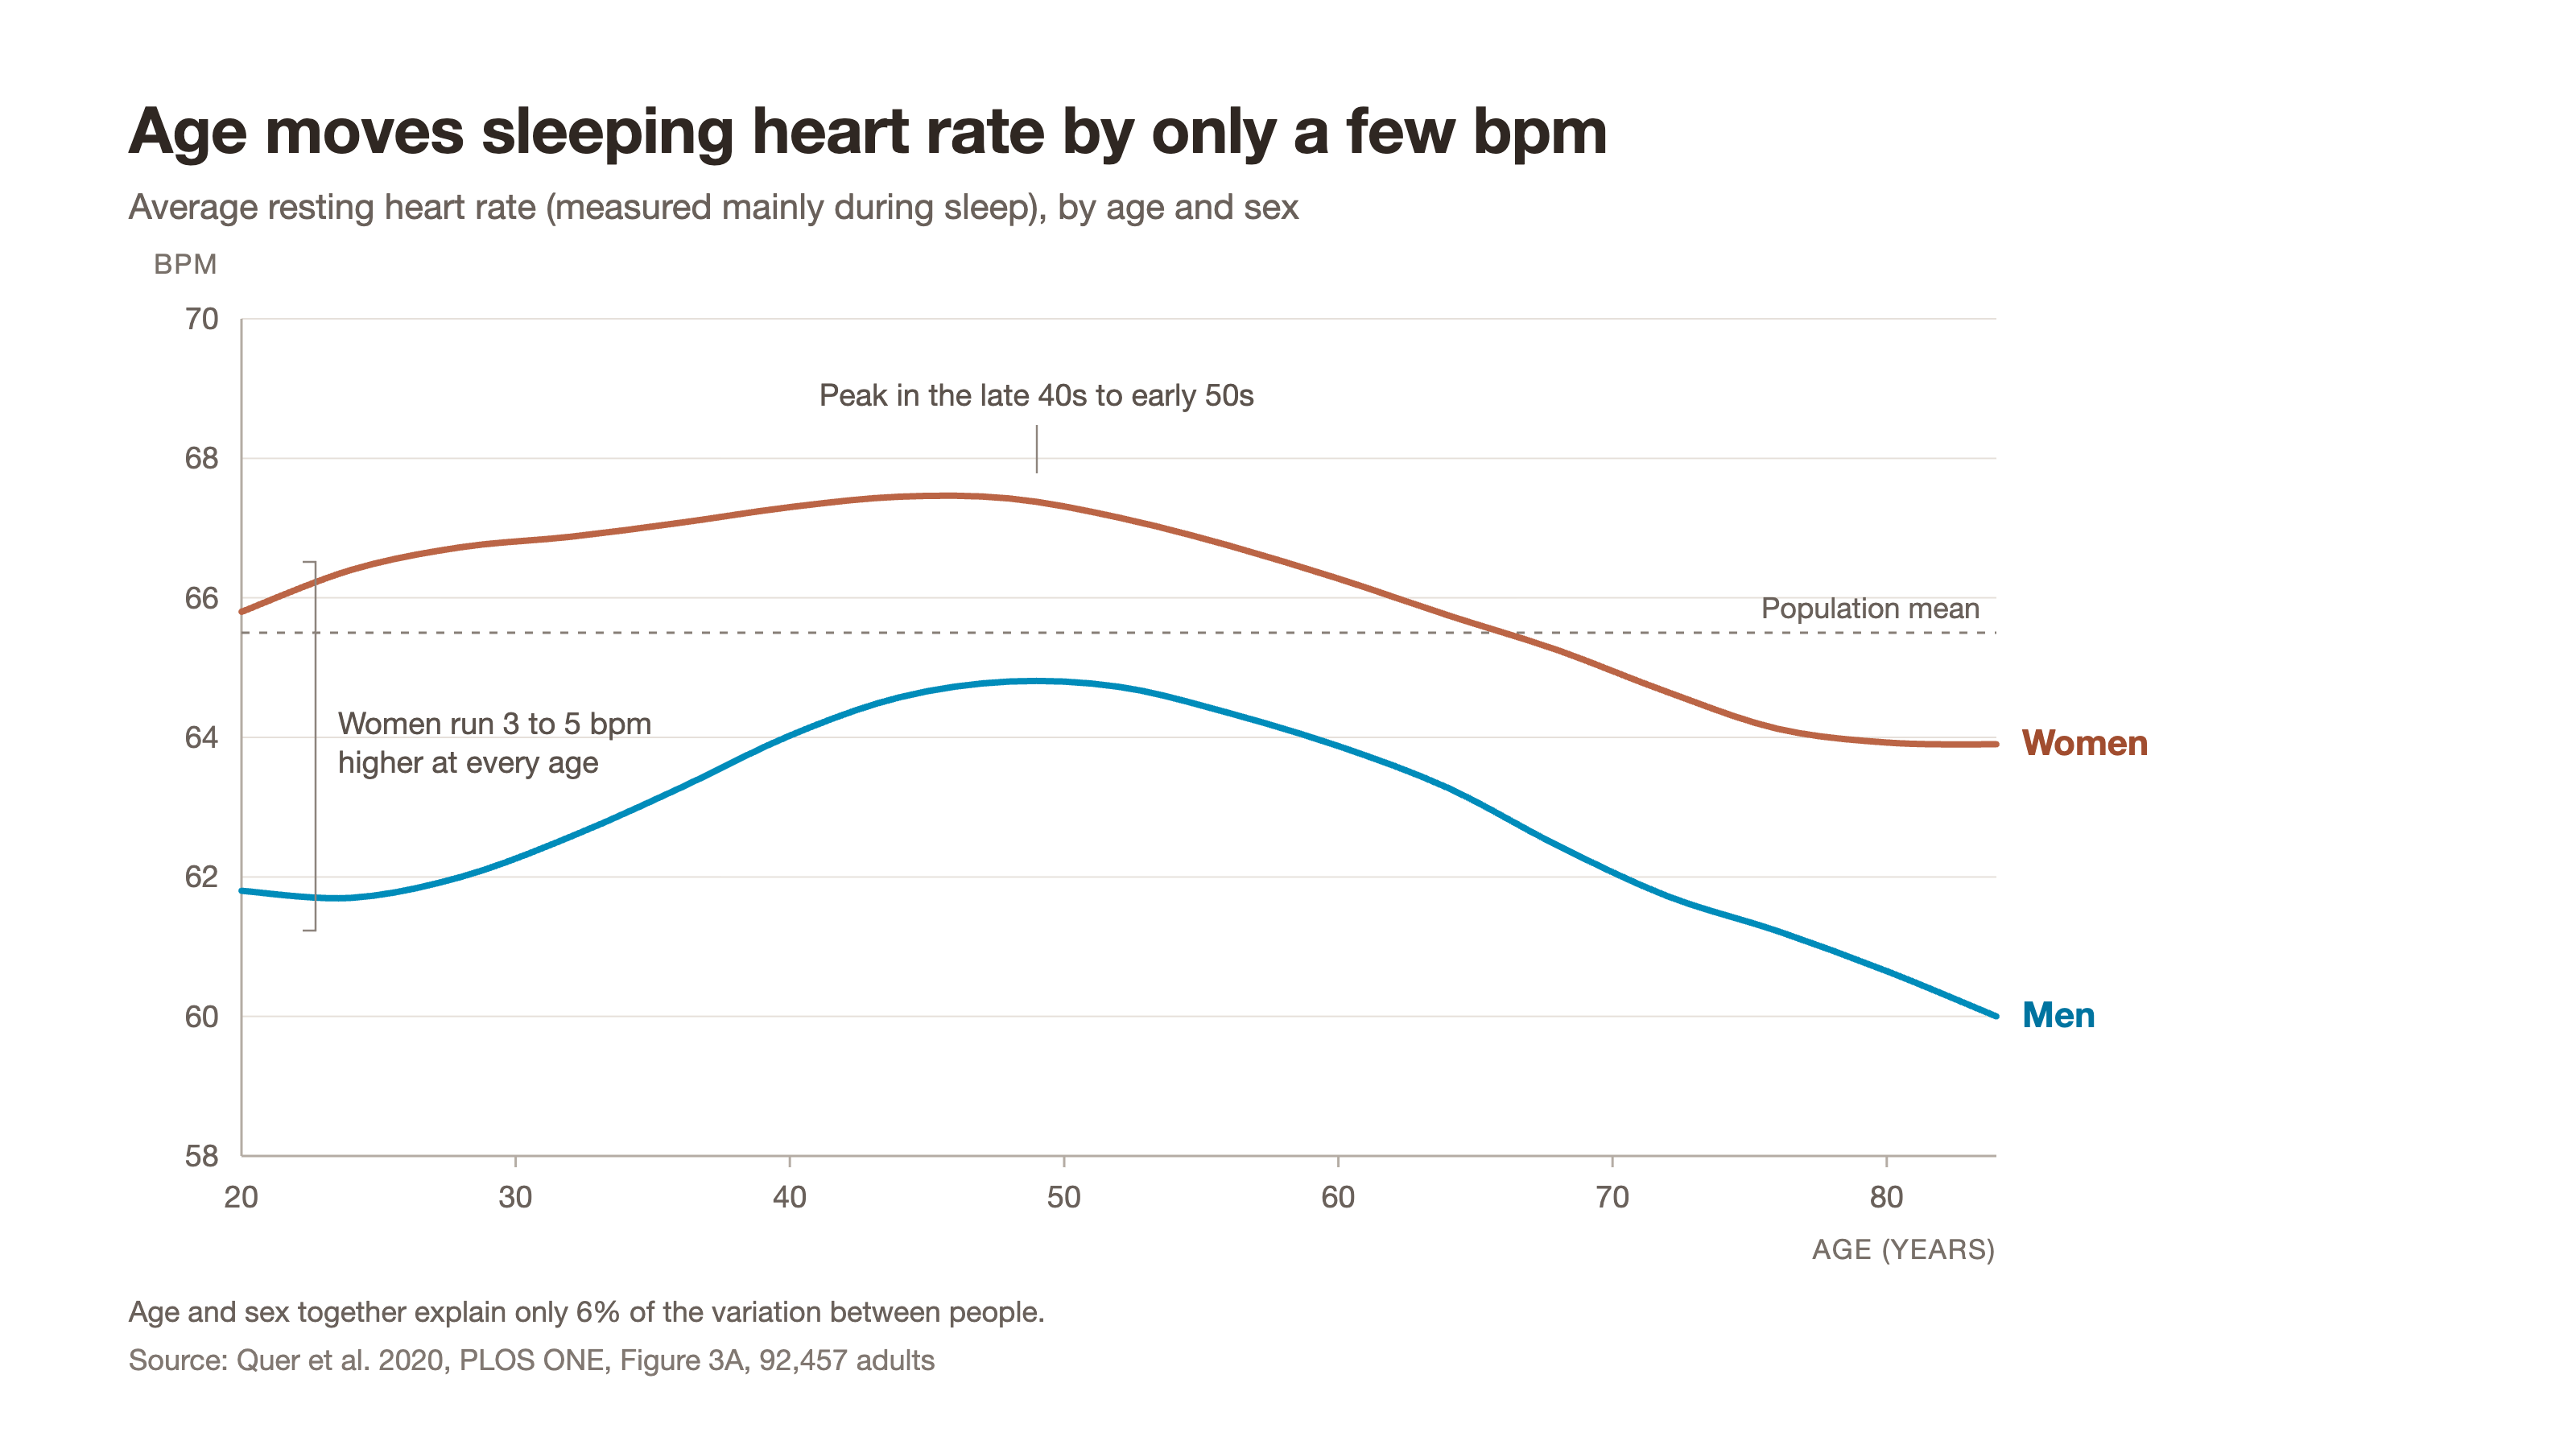
In the Fitbit cohort, average resting heart rate increased until approximately 50 years of age and then began a downward trend, and women had a significantly higher resting heart rate in all age brackets. However, the size of that effect is small: sex alone explained 4% of the variance between individuals, and sex and age together only 6%. Whoop sees the same shape, reporting that resting heart rate increases slightly with age and that women's is a bit higher than men's.
So rather than a table of "normal sleeping heart rate at 30, 40, 50, 60", the more accurate summary is this: expect women to run a few bpm higher than men, expect a slow drift upward through your 20s, 30s and 40s, and expect the differences between people at the same age to dwarf all of that. This is one of the few areas where the popular framing is more wrong than right.
What moves your sleeping heart rate from night to night?
Now we get to the useful part of the article. Since age doesn't make much of a difference, what does? Changes in your personal life.
First, let's provide some background. Most people in the Fitbit study had a median weekly fluctuation of only 3 bpm, and the maximum weekly fluctuation for about 80% of individuals was under 10 bpm. There is also a seasonal rhythm: resting heart rate peaked in the first week of January and fell to a yearly minimum at the end of July, a change of about 2 bpm across the population. So a 2 to 3 bpm wobble is background noise, and you shouldn't read anything into it.
Interestingly, sleep duration itself moves the number. The lowest resting heart rates were registered in people who slept an average of 7 to 7.5 hours per night, with both shorter and longer sleepers running higher.
Alcohol is a big one, and it's dose-dependent. A Finnish study of 4,098 employees wearing a chest-strap heart rate recorder compared nights with and without drinking. Alcohol was dose-dependently associated with increased sympathetic regulation, decreased parasympathetic regulation and insufficient recovery during the first three hours of sleep, and HRV-derived recovery dropped by 9.3, 24.0 and 39.2 percentage units with low, moderate and high intake respectively. Notably, the effects were stronger among young than older subjects and in people with lower baseline sleeping heart rate, and regular physical activity did not protect against them. I covered the sleep-architecture side of this in the nightcap article, and the heart rate side is arguably the easiest thing to see in your own data. In my own case, my 'resting' (sleeping) heart rate is normally 51-53 bpm. On a night when I've drunk - even moderately - that increases to 59-62 bpm.
Illness is another big one, and one your device will likely catch before you do. In a Stanford study of nearly 5,300 smartwatch wearers, 26 of 32 people who caught COVID-19 (81%) showed changes in heart rate, step count or sleep, and 22 of the 25 with symptom data were detected before or at symptom onset, with four cases flagged at least nine days early. 63% of cases could have been detected before symptoms using a warning system based on extreme elevations in resting heart rate relative to the individual's own baseline. The same paper notes the false alarms too: medication, alcohol, travel and emotional stress can all produce sustained increases, and four of seven people with December data showed long elevations over the holidays.
For women, there is a monthly cycle in the data. Women of childbearing age showed greater variability in resting heart rate than men of the same age, with a peak in the early 30s, and this difference disappeared by age 50. The Fitbit authors point out that fertility apps can already identify menstrual cycle phases from daily changes in resting heart rate, so a recurring rise before your period is expected, not alarming.
Finally, fitness is the slow mover, and it's the one you can actually control. A 2018 meta-analysis of 191 studies found that all types of exercise lowered resting heart rate, but only endurance training and yoga did so significantly in both sexes, and the drop was larger in people who started with a higher resting heart rate and in younger participants. It shows up at night too: in the Danish ECG cohort, people with a low physical activity level had a night-time heart rate of 68.2 bpm against 65.1 in the more active group. The Fitbit authors make the same point from the other direction, noting that changes in resting heart rate over weeks to months might indicate changes in cardiovascular fitness, whereas changes over days point to infection or another acute trigger.
I can vouch for this one personally, as I started running 4-6 times per week around two months ago, and over that time my sleeping heart rate has dropped from the mid 60s to the low 50s. That is a bigger fall than the average study reports, which fits with the meta-analysis (I started from a higher number and the early gains are the biggest). Still, if you take up any regular endurance exercise, expect the night-time number to be the first place you see it.
Does a high sleeping heart rate actually matter?
This is where we need to be careful. While the research is real, it's easy to over-read, and it's important to discuss this with your doctor if you're concerned.
At the population level, higher resting heart rate is associated with worse outcomes. A 2016 meta-analysis in the CMAJ pooled 46 studies covering 1,246,203 people, and found that each 10 bpm increase in resting heart rate carried a relative risk of 1.09 for all-cause mortality and 1.08 for cardiovascular mortality. A larger 2017 review of 87 studies found increased risk of coronary heart disease, sudden cardiac death, heart failure, atrial fibrillation, stroke, cancer and all-cause mortality with greater resting heart rate.
What I found more interesting is that the night-time number appears to be a better predictor than daytime resting heart rate. In the Danish study I mentioned earlier, all three measures of heart rate (resting, 24-hour and night-time) were associated with mortality, but after adjustment for conventional risk factors, biomarkers and medication, only night-time heart rate remained in the model, with a hazard ratio of 1.17 per 5 bpm increment. The authors also noticed that the risk threshold appeared to sit at about 70 bpm for resting and 24-hour heart rate, but at about 60 bpm for night-time heart rate. Their explanation is simple: by removing sensory input and physical and mental activity, night-time heart rate is a cleaner measure with a better signal-to-noise ratio.
So yes, your ring or other wearable is measuring something that matters. That being said, these are associations in populations, most of them in people over 55, and a single high night means nothing. What the studies point to is your habitual level, and the Danish authors are explicit that it is a high mean level, not short periods with rapid increases, that carries the prognostic weight. If your sleeping heart rate sits persistently above 70 to 75, the modifiable levers (alcohol, late caffeine, fitness, sleep duration) are worth pulling, and a GP visit is worthwhile. If it's 62 on Monday and 66 on Tuesday, you can close the app and focus on longer-term trends.
What is HRV and why is it so confusing?
Now that we've discussed heart rate, let's discuss heart rate variability, the second number your device gives you (and in my experience the far more confusing of the two). That is partly because it's less intuitive (higher is generally better, which feels backwards), and partly because the industry hasn't agreed on what to measure.
Let's start with the basics. HRV is the variation in time between successive heartbeats, and it is a non-invasive index of the autonomic nervous system. A heart that beats with a perfectly even 1,000 ms gap has low HRV, and one that varies 950, 1,040, 980 has higher HRV. That variation is mostly the parasympathetic ("rest and digest") side of your nervous system nudging the rhythm around, so more of it usually means a more relaxed, recovered system. We wrote about the interpretation side in an earlier HRV piece, so here I'll stick to the numbers.
One thing I only learnt after a few weeks of reading is that Apple Watch's original HRV metric uses SDNN (standard deviation of normal-to-normal intervals), whereas most other wearables (Whoop, Oura, Garmin, Fitbit) use RMSSD (root mean square of successive differences). An SDNN reading of 35 ms and an RMSSD reading of 35 ms are not interchangeable, and even devices using the same formula can differ in sampling and averaging. RMSSD looks at beat-to-beat jumps and tracks parasympathetic activity closely. SDNN looks at the overall spread, which picks up slower rhythms too. In one 93-day comparison on a single wearer, Apple averaged 54.5 ms (SDNN) against Oura's 44.7 ms and Fitbit's 38.7 ms (both RMSSD), and the author's advice was blunt: don't compare across devices, and definitely don't compare RMSSD and SDNN.
Even more confusingly, it goes further than the formula. Whoop calculates HRV during the deepest sleep of the night, Oura averages 5-minute samples across the whole night, and Fitbit uses the longest sleep period in the past 24 hours. Apple has now added a "Recovery HRV" that uses RMSSD, but only on Series 12 and Ultra 4, and the advice is to keep a separate baseline for each metric. Time of day matters as well: in the Fitbit dataset, all HRV metrics peaked between 5 and 8 am and hit their minimum in the late evening, and the authors advise interpreting HRV at the same time of day.
The practical upshot is that if a friend with a Whoop says their HRV is 90 and yours on an Apple Watch is 45, you have learned nothing. Same goes for those "good HRV is 60 to 100" lines you'll see online. The only comparison that holds up is you against you, on the same device.
What is a good HRV for my age?
With all of those caveats, there are still two large datasets worth knowing about, and both say the same thing about age: HRV falls, and it falls fastest early.
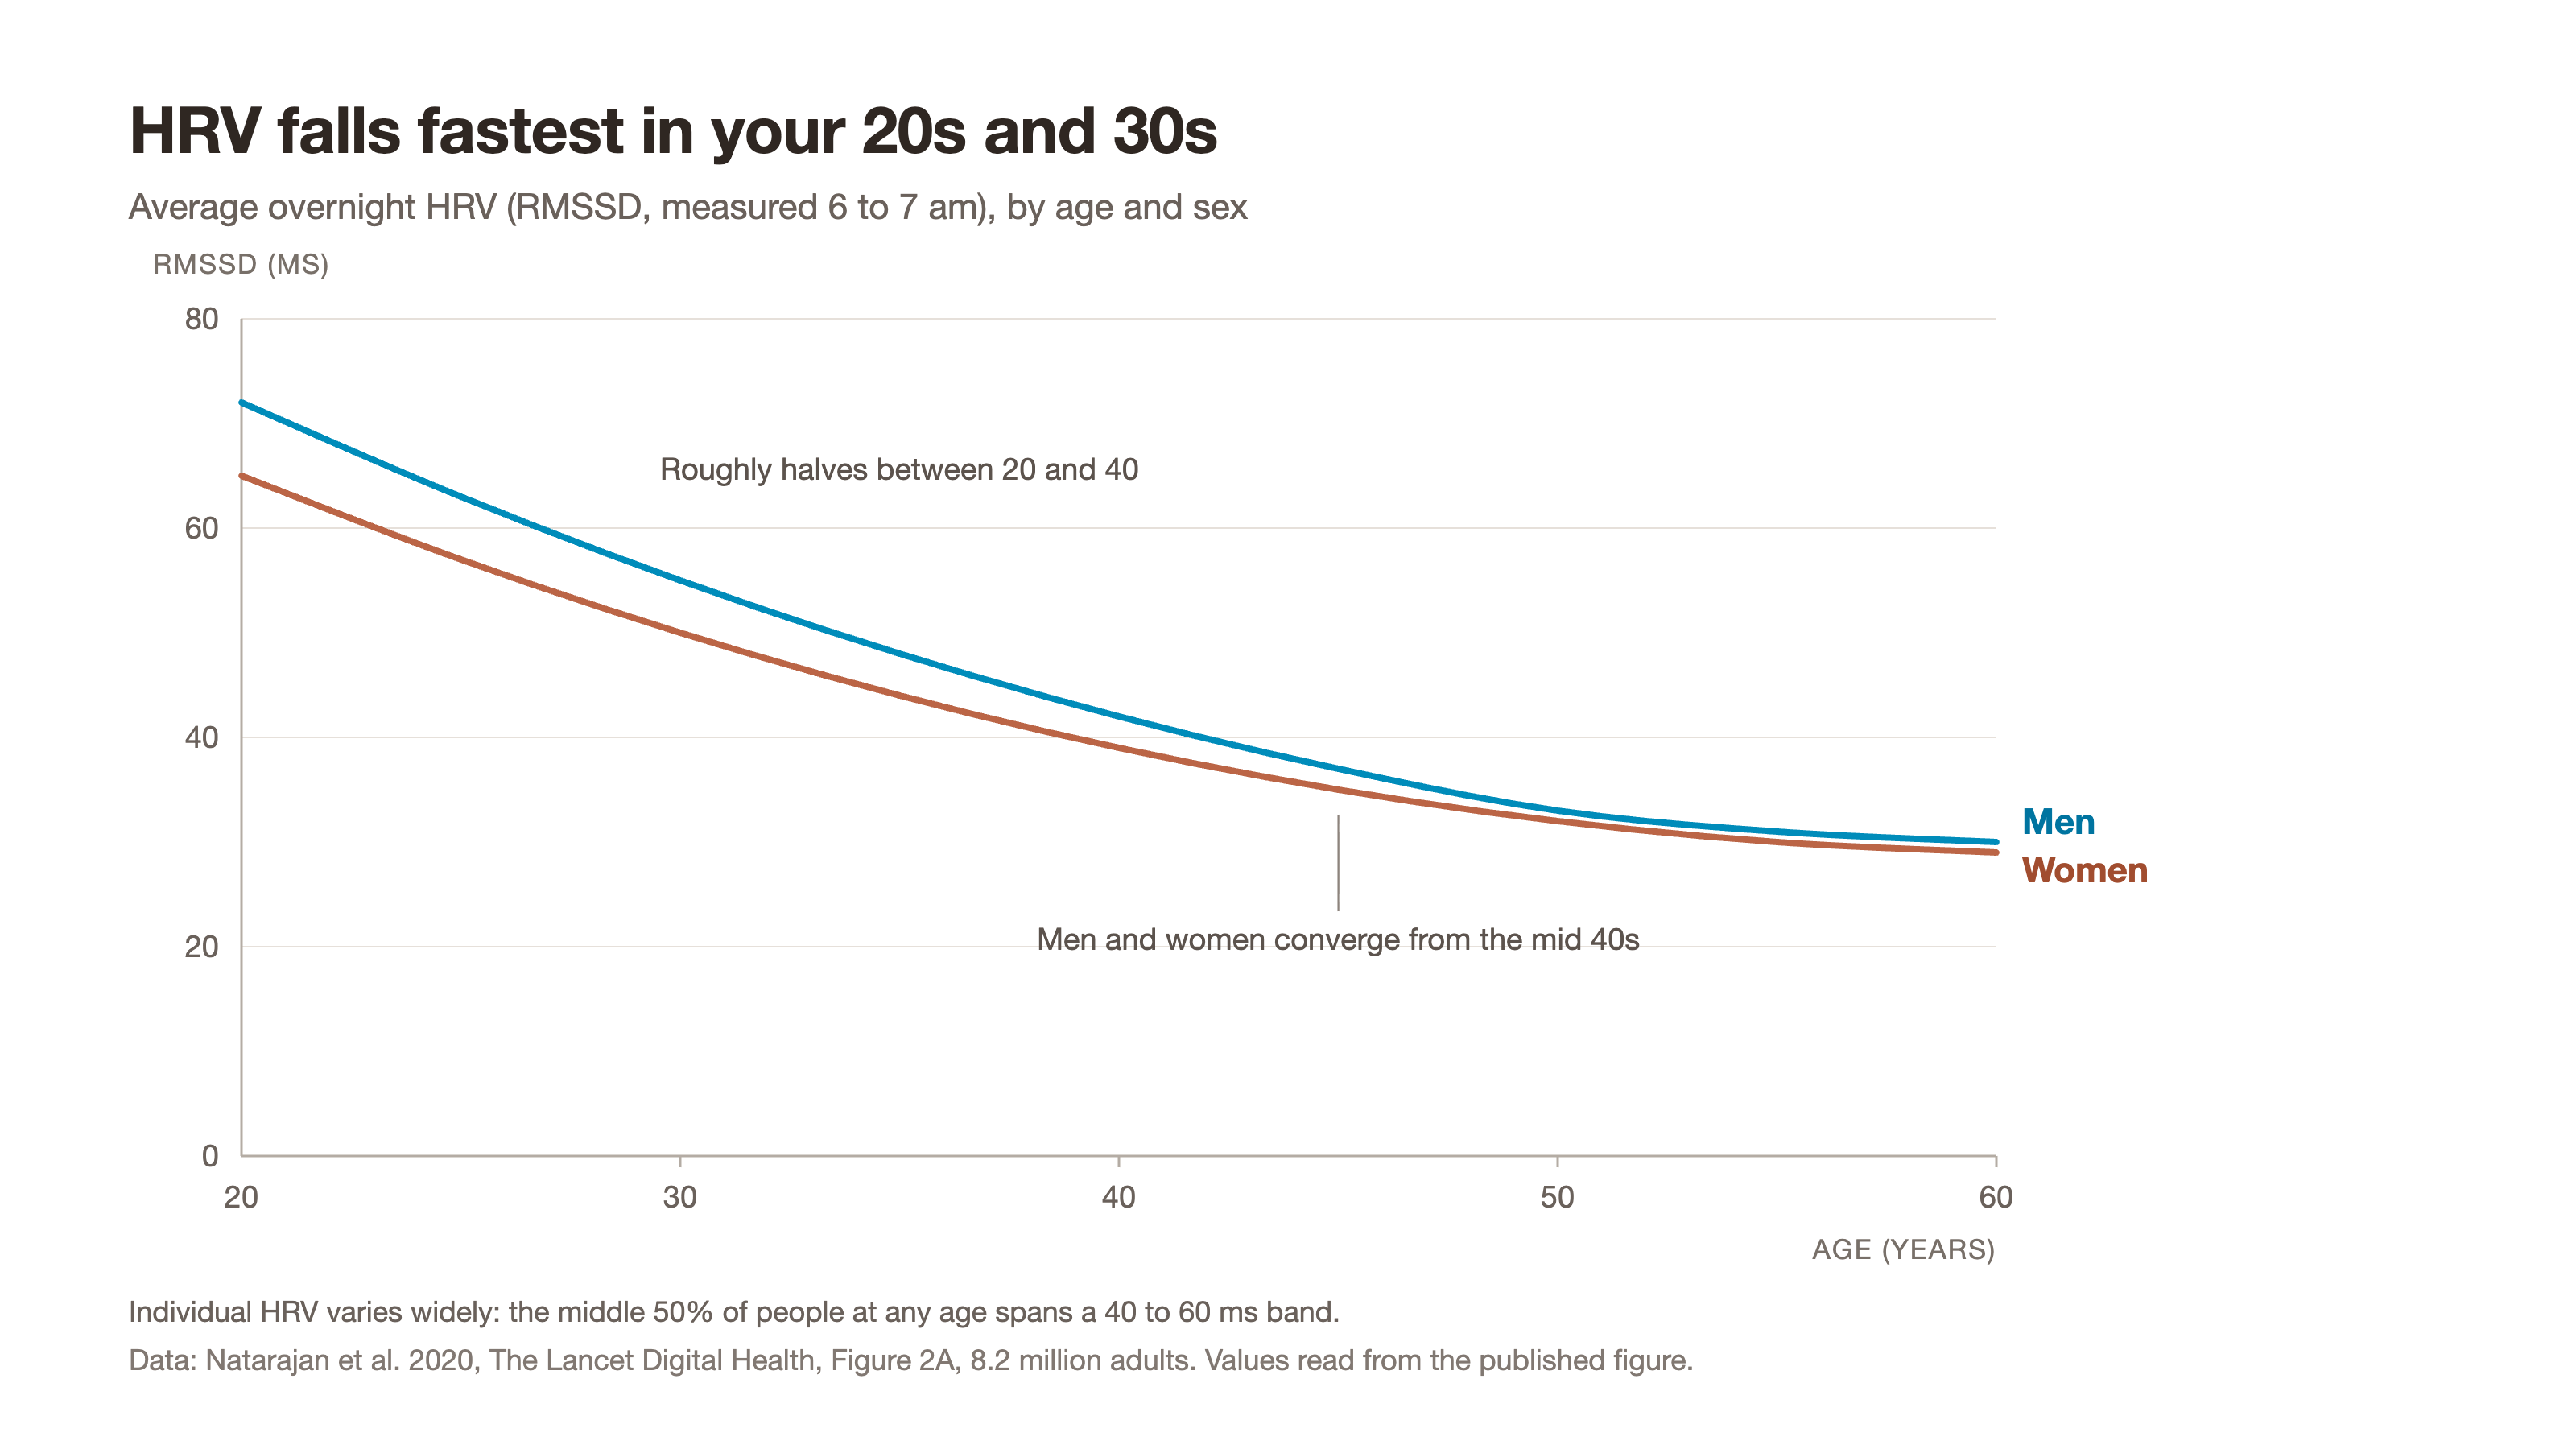
The biggest is a Lancet Digital Health study of 8,203,261 Fitbit users. HRV metrics decreased with age, and parasympathetic measures (RMSSD and high-frequency power) declined faster than the broader measures. Both types decreased most rapidly from age 20 to 40 and more slowly after that. The size of the drop is large: for men measured between 6 and 7 am, high-frequency power fell by 82.0% from age 20 to 60, and for women by 80.9%. As a concrete RMSSD anchor, women aged 40 to 41 measured in that morning window averaged roughly 38 to 43 ms depending on device model.
Whoop also publishes its own member averages, which are the most-quoted "HRV by age" numbers online. The average HRV for all Whoop members is 65 ms for men and 62 for women. For 25-year-olds it's 78, for 35-year-olds 60, for 45-year-olds 48, and for 55-year-olds 44. The middle half of 25-year-old men fall roughly between 50 and 100 ms, and 45-year-olds around 35 to 60. Women of the same ages run from about 45 to 90 down to 30 to 55. Whoop is careful to add that a small percentage of members (often elite athletes) skew the averages upward, and the most common HRV is actually about 40 ms for men and 37 for women.
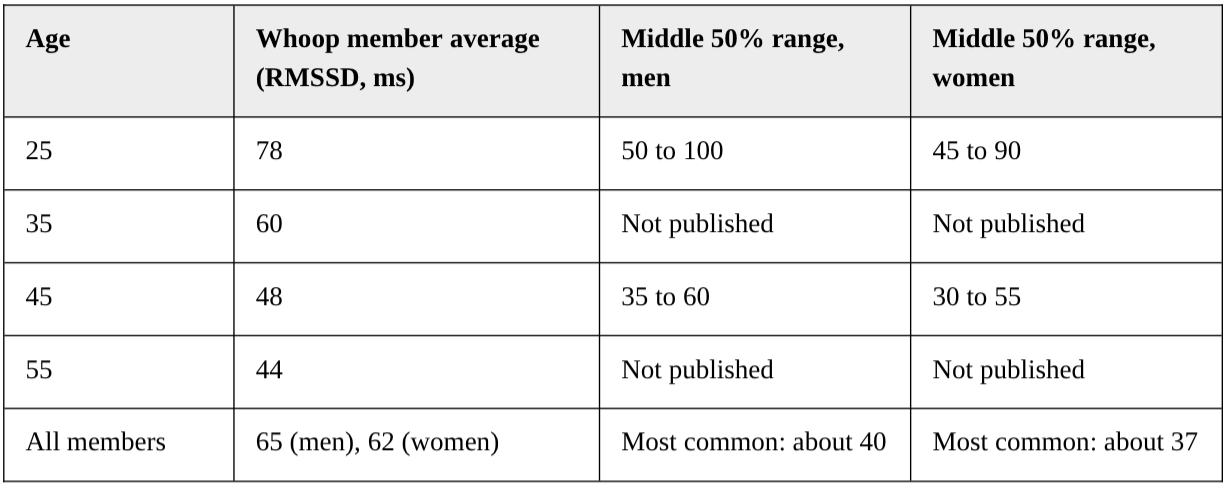
Two caveats on the table above. It is RMSSD, so it is meaningless for an Apple Watch SDNN reading. And it is drawn from a population that is fitter than average, so a general-population figure would sit lower. Whoop's own 'most common' figures of 40 and 37 ms, and the Fitbit average of around 40 ms for women in their early 40s, are probably closer to what a typical adult sees.
Sex and fitness both shift the picture. In a German study of 1,906 healthy adults, women under 55 showed notably higher RMSSD than men of the same age, reflecting greater parasympathetic dominance, and the gender difference faded after 55. On fitness, the Fitbit paper found a dose-response with daily steps: among 20 to 24 year olds, people averaging 12,000 to 13,000 steps a day had 21 to 23% higher high-frequency power than those averaging 5,000 to 6,000, and the model suggests that age group could raise HF power by 1 ms² with roughly 30 extra steps a day, versus 200 to 300 extra steps for 50 to 54 year olds. Interestingly, though, low HRV does not automatically mean unfit: Whoop cites an elite ultra runner averaging 47 ms and a professional fighter averaging 162.
How should you actually read these numbers?
Having gone through all of this, here is what I now do with my own data, and what I'd suggest for anyone in their first few weeks with a tracker.
Give it time before you judge anything. You need a baseline, and a baseline takes a few weeks of consistent wear. Most apps calculate one for you (Garmin, for instance, builds a personal range from about three weeks of data), but you can also just look at your 30-day average once you have one. Until then, every number is context-free.
Watch changes, not levels. The research on both heart rate and HRV converges on the same point: within individuals, resting heart rate is much more consistent over time than it is between people, with detectable, infrequent episodes outside the norm. A sleeping heart rate 8 to 10 bpm above your own average for two or three nights running is worth paying attention to (illness, alcohol, stress, a hard training block). A single night is not.
Compare like with like. Same device, same metric, same time window. If you switch devices, start a new baseline and don't try to reconcile the old numbers with the new ones.
And finally, don't let the numbers run your mornings. I've written before about sleep tracking anxiety and I think it applies doubly to HRV, which bounces around from night to night by design.
Conclusion
A sleeping heart rate somewhere between 50 and 80 bpm covers 95% of adults, the population average sits in the mid 60s, and your age moves that far less than the internet suggests. HRV falls steeply with age, but the number your device shows depends so heavily on which device and which formula that only your own trend is worth reading. For both, the useful signal is a sustained departure from your own normal, not where you sit on somebody else's chart.
If you want to understand what the sensors are doing to produce these numbers in the first place, this article on what a sleep ring actually measures is the natural next read. And if your sleeping heart rate has been sitting above 75 for weeks, it's worth discussing with a doctor.
